Financial Stability
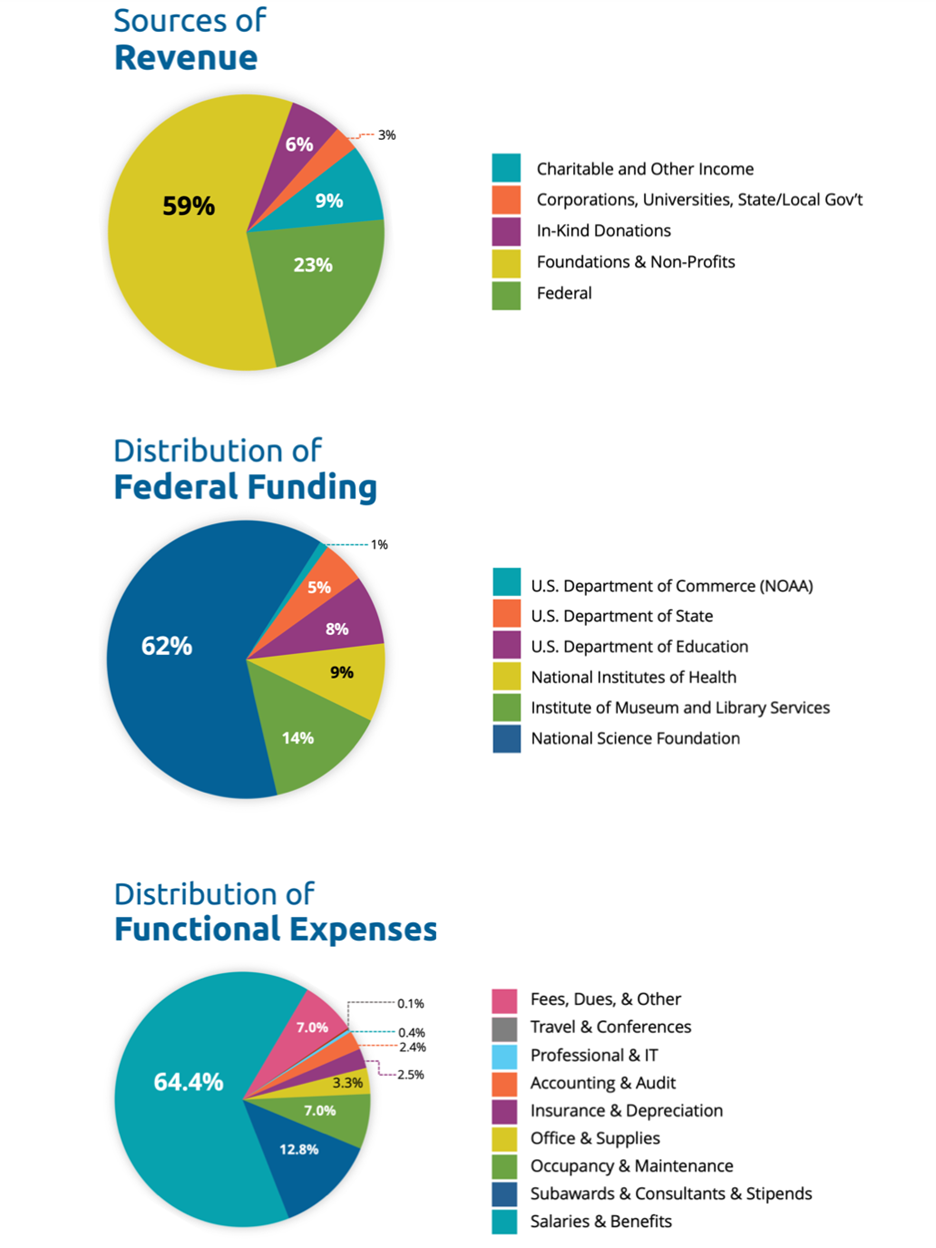
Knology had a very stable 2021. With contract revenue holding steady throughout the year, and fewer COVID interruptions in project work, we closed the year in good financial standing.
Knology had a very stable 2021. With contract revenue holding steady throughout the year, and fewer COVID interruptions in project work, we closed the year in good financial standing. Early in the year, the PPP loan we received was forgiven, further adding to our financial stability. We would also like to thank 40 X Owner LLC for the kind donation of office space during early 2021, when we were unable to make use of our offices due to COVID restrictions.
Condon, O’Meara, McGinty & Donnelly LLP performed our 2021 audit and issued an unmodified opinion. We summarize our financial standing on the following pages. The full audit is available on request.
Statement of Financial Position
Assets
| 2021 | 2020 | |
|---|---|---|
| Cash and cash equivalents | $ 687,394 | $ 586,981 |
| Contract service fees receivable | 168,161 | 299,665 |
| Prepaid expenses | 22,893 | 14,892 |
| Security deposits | 24,670 | 24,670 |
| Property and equipment, net | 24,514 | 41,791 |
| Total assets | $ 927,632 | $ 967,999 |
Liabilities and Net Assets
| 2021 | 2020 | |
|---|---|---|
| Liabilities | ||
| Accounts payable and accrued expenses | $ 60,088 | $ 107,151 |
| Deferred rent | 45,452 | 15,225 |
| Unearned revenue | 144,015 | 316,094 |
| Paycheck Protection Program loan | - | 193,617 |
| Total liabilities | 249,555 | 632,087 |
| Net assets with donor restrictions | 678,077 | 335,912 |
| Total liabilities and net assets | $ 927,632 | $ 967,999 |
Statement of Activities
Support and Revenue
| 2021 | 2020 | |
|---|---|---|
| Contract service fees | $ 1,443,429 | $ 1,493,279 |
| Contributions | 60,829 | 24,540 |
| Government grant (CARES Act / PPP Loan) | 193,617 | - |
| In-kind contributions* | 10,617 | 95,439 |
| Other | 10,084 | 4,808 |
| Total support and revenue | 1,718,576 | 1,618,066 |
Expenses
| 2021 | 2020 | |
|---|---|---|
| Program services | $ 854,658 | $ 1,006,358 |
| Supporting activities | ||
| Management and general | 402,035 | 519,971 |
| Fundraising | 119,718 | 108,644 |
| Total supporting activities | 521,753 | 628,615 |
| Total expenses | 1,376,411 | 1,634,973 |
| Increase (decrease) in net assets | 342,165 | (16,907) |
| Net assets without donor restrictions, beginning of year | 335,912 | 352,819 |
| Net assets without donor restrictions, end of year | $ 678,077 | $ 335,912 |
* Excluding in-kind donation of office space from January through June 2021 provided by GFP Real Estate LLC, the landlords for our New York offices. The in-kind donation of office space from October through December 2020 is included.

Photo credit: Petr Sidorov on Unsplash