A Survey of Libraries: Tell Us About Your Community Partnerships!
How can partnerships help libraries reach their programming goals?
Libraries of all types are taking on new roles and responsibilities. Through robust programming agendas, they're at the center of community-building efforts all across the US. As they do this important work, libraries are increasingly forging partnerships with different groups and institutions within the communities they serve. Working with schools, churches, healthcare providers, and a variety of other organizations, they're creating joint programming to directly address people's needs.
These partnerships are key to libraries' community engagement efforts. We know that libraries do some of their best work when working with other community organizations. But how exactly do they do this? Who are libraries partnering with, and how are they interacting with their partners? What kinds of partnerships work well, and what makes these effective? And how can partnerships be leveraged to support libraries' programming goals?
Answering these questions is incredibly important. If we understand what best partnership practices for libraries look like, we can then help equip library workers with the tools they need to ensure that their partnerships are maximally effective. And with these tools, they'll be in a much better position to build stronger and healthier communities.
Toward that end, as part of our research through the National Impact of Library Public Programs Assessment (NILPPA), we developed and administered a survey designed to give library workers an opportunity to talk about their experiences in partnering with community organizations. In future posts, we'll share our key findings from this survey.
But before we get to that, we wanted to share some information about the libraries we heard back from. Our survey asked respondents to identify themselves in terms of their library type, their service area and population, their staff size and operating budgets, and their weekly operating hours. With regard to each of these variables, responses varied significantly. This is great for our research, because it means that the libraries we heard back from represent an accurate cross-section of the American library landscape. We believe that our survey successfully captured the diversity of US libraries, and that its results put us in a great place in terms of creating partnership tools that libraries can use regardless of their type, size, location, or operating contexts. For evidence of this diversity, see the institutional data below.
Who Told Us About Their Library's Partnerships?
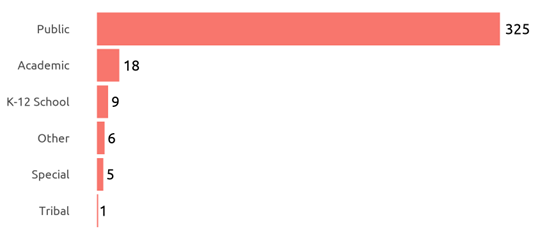
Our survey included a number of open-ended questions on partnerships and their effectiveness. Rather than require respondents to list all their library's partners, we asked forin-depth information on one partnership they saw as particularly valuable. The survey was distributed through the American Library Association's mailing lists. A total of 364 libraries responded and told us about a partner they work with. As can be seen below, the vast majority of these (325, or 89.3%) were public libraries, although some classified themselves as academic, K-12, special, and tribal libraries.
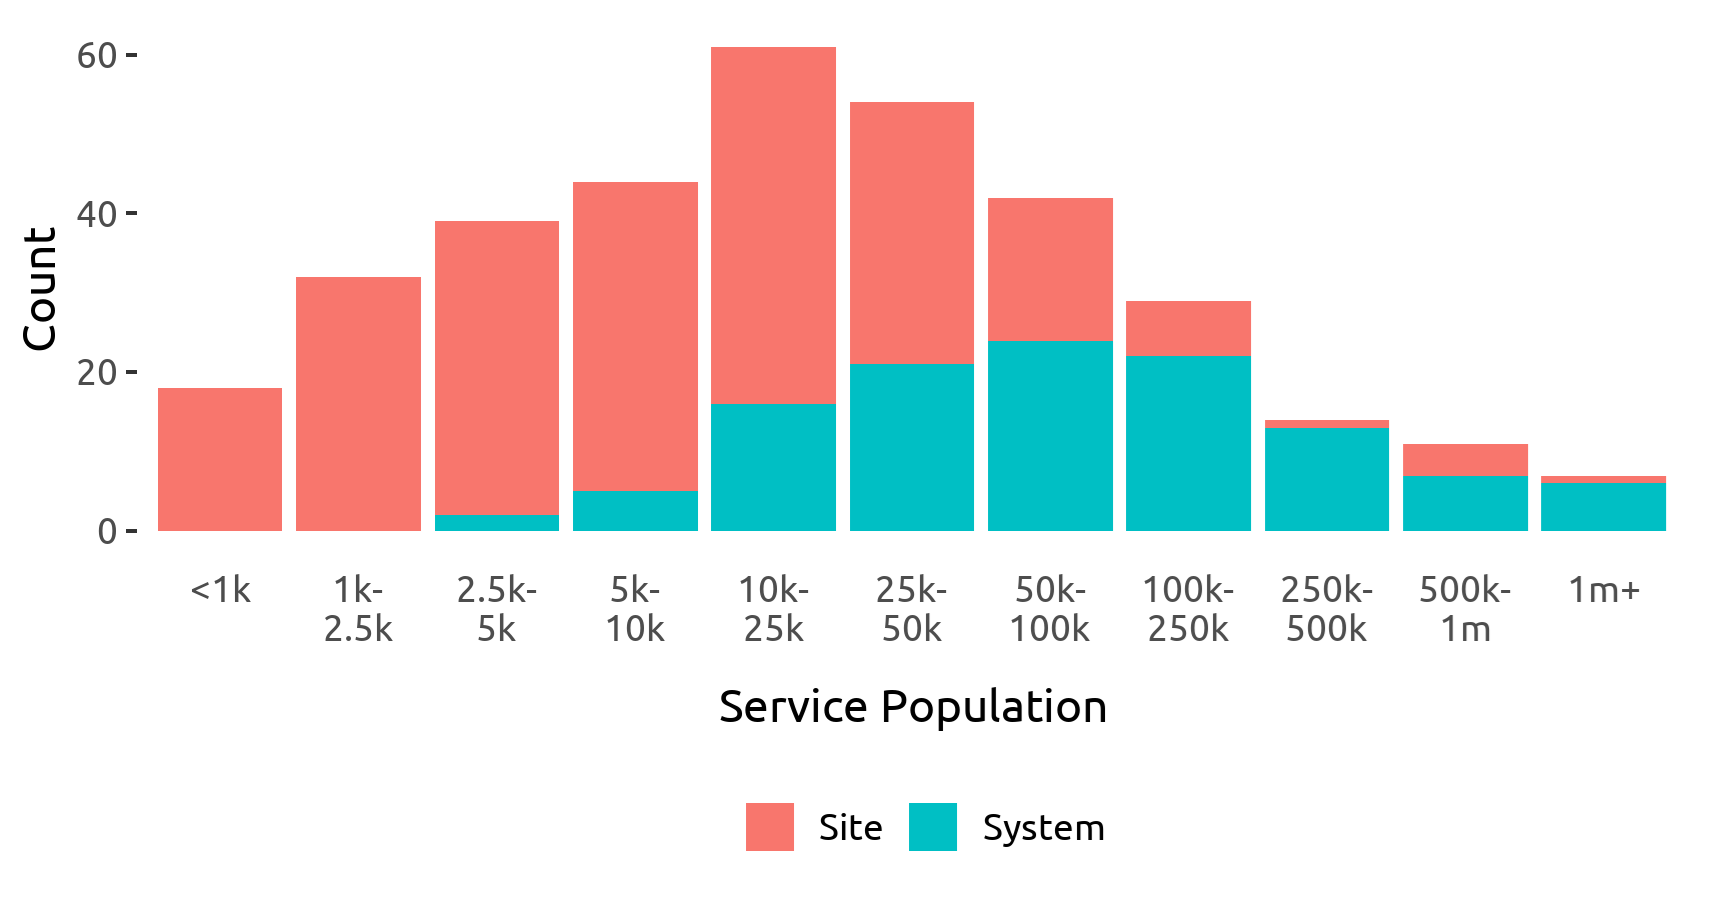
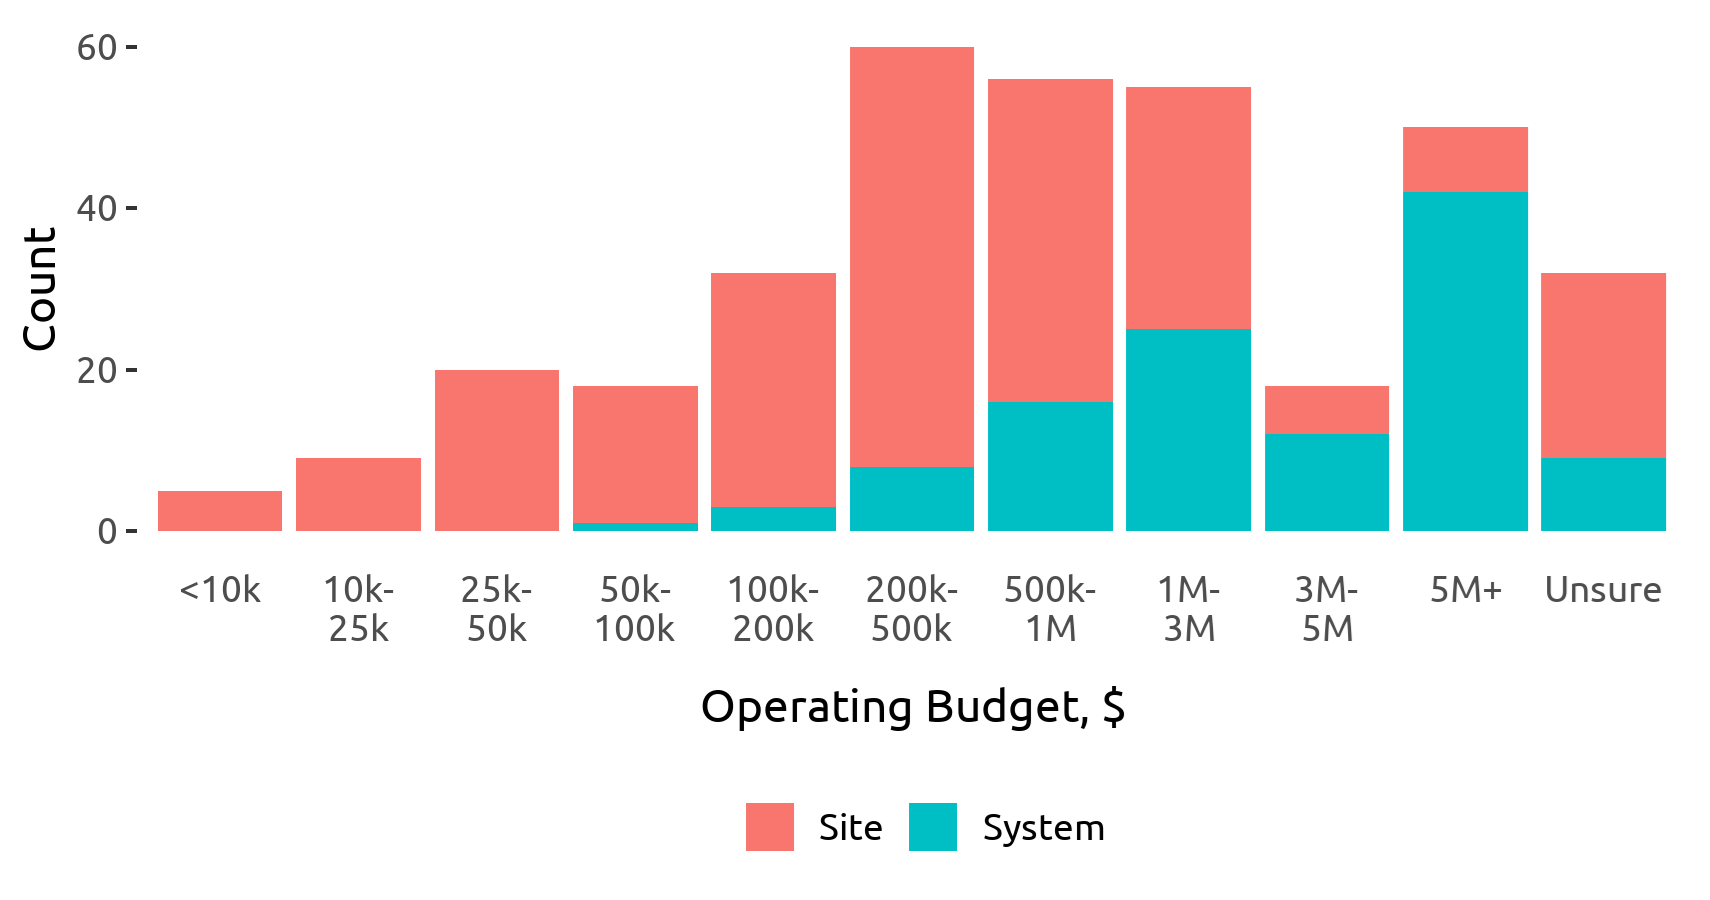
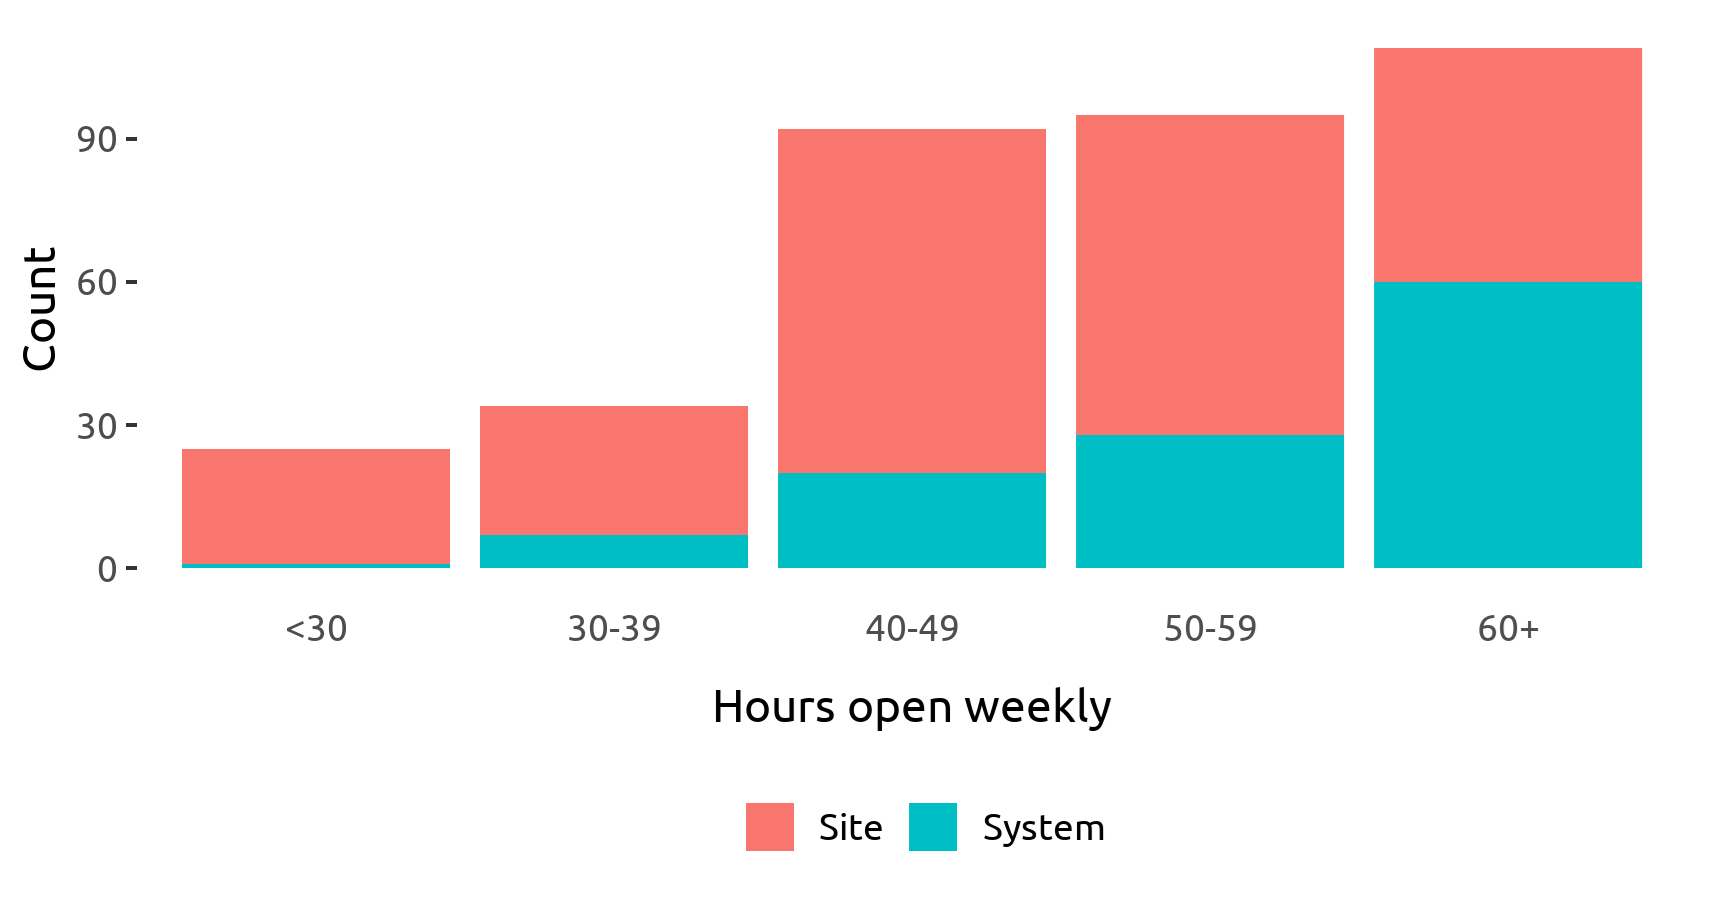
Importantly, we also asked whether respondents were answering on behalf of a single library site or a library system, since these different perspectives might influence how they work with partners. The majority (246) said they were answering as a site, and 118 as a system. In the following graphs, single site responses are shaded red, whereas the system responses are shaded blue.
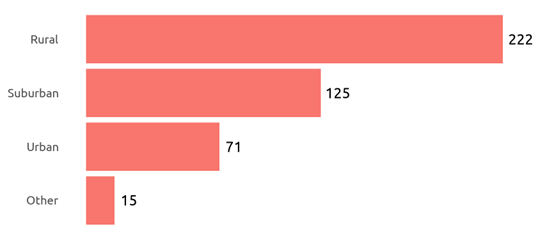
In terms of the populations they serve, these 364 libraries are quite diverse. When asked to describe their service community, respondents could select more than one option (which explains why the graph below lists a total of 434 responses). The largest group of survey respondents (222) indicated that they serve rural areas, but we also heard from many working in suburban (125) and urban (71) communities. A few chose "other," and some felt that the options we provided did not accurately describe their service area.
The communities these 364 libraries serve also vary by size. Some indicated a service population of less than 1,000 people, while others estimated their service populations at around 1 million people. As can be seen below, most libraries put their service populations somewhere between 2,500 and 250,000.
In addition to gathering demographic data pertaining to each library's service community, our survey also asked about several internal matters—including staff size, operating hours, and operating budgets. As can be seen in the next three charts, there was great variety in each of these areas.
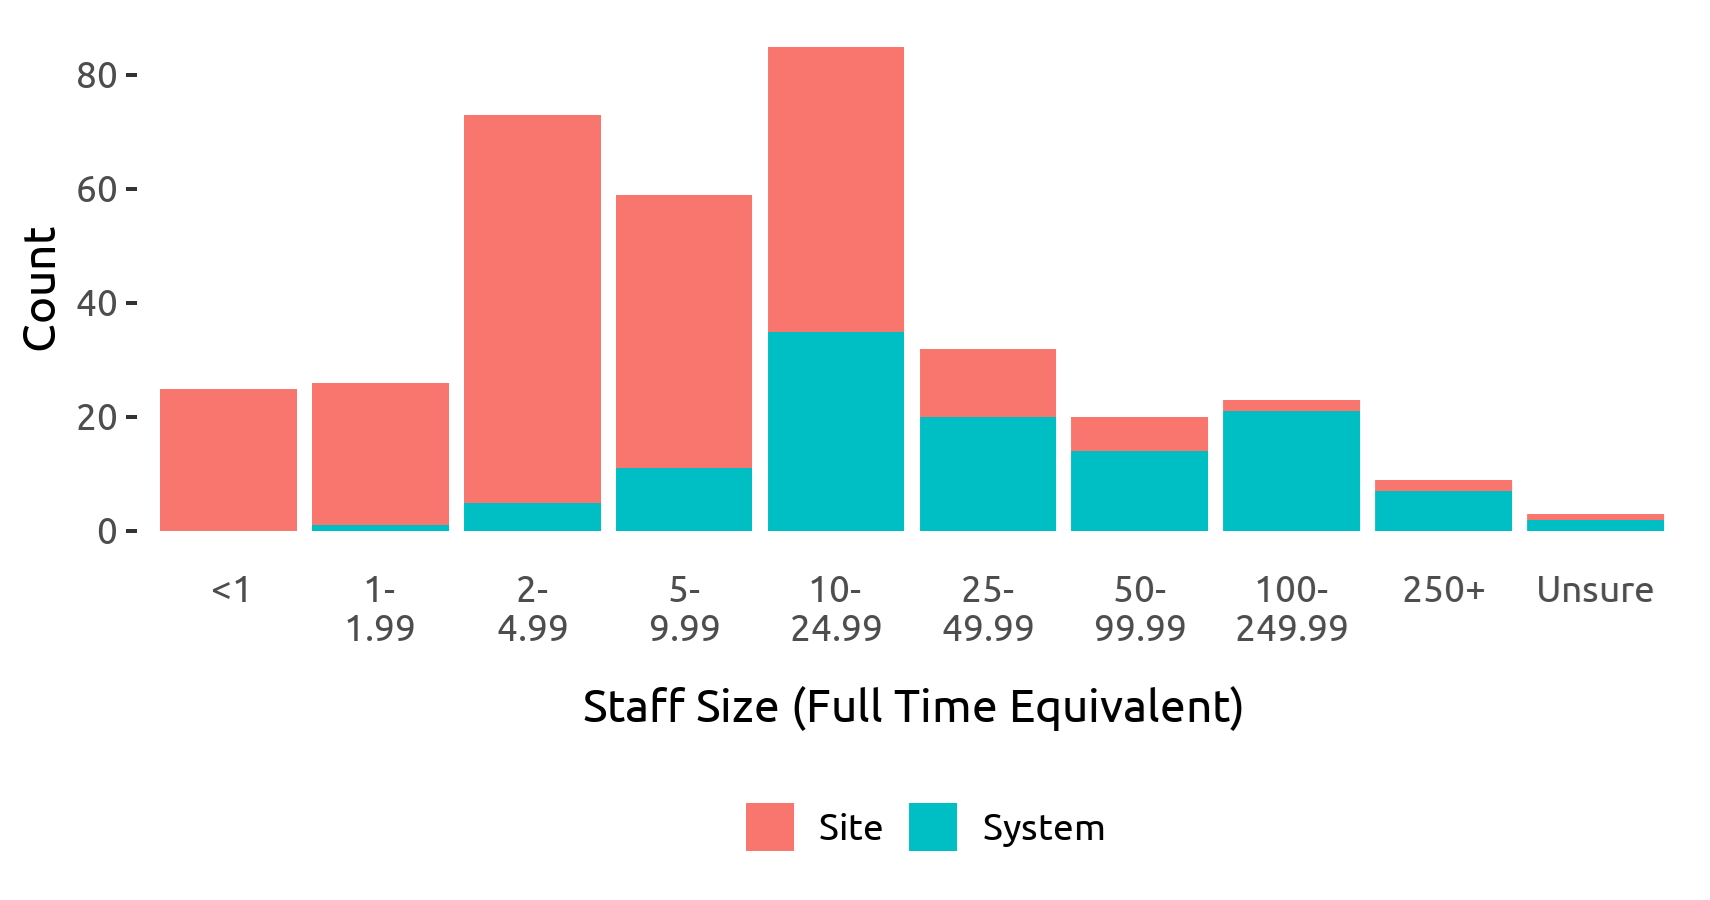
The libraries who responded to our survey are very different in terms of staff composition. Seven of these libraries have less than one full-time staff member, while nine have more than 250. Most of the 335 libraries that provided information on this fell somewhere in the middle, with "10-25" being the most commonly selected response.
As these libraries have very different service populations, it would not be surprising to see significant differences in their respective operating budgets. And this is precisely what we found. A few of the 355 libraries we received data from indicated an annual budget of less than $10,000, while on the other end of the spectrum, 50 libraries put this figure at over $5 million. As the graph below shows, most are somewhere between these poles, with the $200,000-400,000 range being the most commonly selected option.
There is also a fair amount of variability in these libraries' operating hours. The most frequent answer was 60 or more hours per week—an unsurprising finding given that many people responded on behalf of a library system.
Let's Put It to Work!
Looking at the above graphs, it's clear that we heard from libraries working in lots of different contexts. Whether classified by type, by service areas and populations, or in terms of their operations, we can see that our survey reflects a lot of the diversity found within the US library system. This is great for our research, since our goal is to generate generalizable knowledge that's applicable to libraries of all shapes and sizes. We're confident that our results will allow us to do this, though of course, we're still open to hearing more. So if you've got something to add to this discussion, please let us know!
Over the next few months, we'll be sharing more about what we found in the survey, and asking for your input. We're still in the process of collecting data, and YOU are an important part of that process! Though our survey is closed, you can offer feedback in other ways—either by commenting on this article or by sending an email to programminglibrarian@ala.org. The more libraries we hear from, the more confident we'll be about our findings, and the more meaningful our work will be for the library field.
Keep an eye on this site moving forward, and in the meantime, tell us about your library's community partnerships!
Funding
These materials were produced for National Impact of Library Public Programs Assessment (NILPPA), a project funded by the Institute of Museum and Library Services. The authors are solely responsible for the content on this page.
Photo by Vardan Papikyan at Unsplash